 At a recent KORE online meet-up, digital marketing expert David Nagy shared tips about how to best use online tracking stats to impact revenue.
On November 16, 2020, KORE hosted a Zoom Meet-up with its members that featured outdoor gear entrepreneur Jamie Clarke and David Nagy, the founder of eCommerce Canada. Both men live in the Calgary area and joined the call to discuss the outdoor equipment market and, specifically, how small businesses can succeed within it.
Clarke provided colour commentary as he described his successful attempts to climb the seven tallest mountains of the world, including Mt. Everest twice. He also discussed his 14 years as an outdoor retailer in the brick and mortar industry and his jump to e-commerce.
Nagy (pictured above) offered more practical tips for small business owners in the outdoor gear industry specifically around e-commerce. It’s a topic he knows a lot about having worked in the online marketing realm for the past 15 years with a wide variety of companies from huge corporations such as Virgin and GM to smaller businesses such as Rocky Mountain Soap. It’s also a topic that’s top of mind for every business these days given the surge in online purchasing activity, especially over the past year. “The channels are changing and getting good at the internet thing is a necessity now,” he said. He cited the fact the $200 billion worth of revenue is now in online sales and because of that, “retail will never be the same.” But he also stressed that “opening a shopify account isn’t enough. This isn’t a Field of Dreams scenario because when you build it, they might not necessarily come.” Therefore, every small business should align themselves with a website data tracking tool, such as Google Analytics, he said, and once that’s completed, there are three e-commerce indicators every small business must track because they’re closely aligned with revenue:
- Sessions
- Conversion Rate
- Average Order Value
Three E-Commerce Revenue Indicators Small Businesses Must Track
1. Sessions
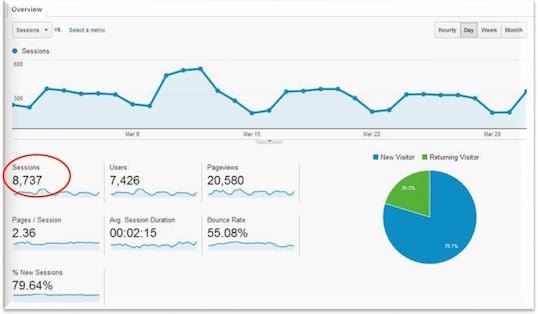
This measurement shows how many individual browsing visits your site receives per day. It’s basically Google’s word for website “traffic” or “hits” and it’s important because it is the number of potential customers you have. Put another way, if you were a brick and mortar operation, this is the amount of people who come inside to look around.
It’s a very easy number to track with such tools as Google Analytics and it’s also an easy number to grow by improving search engine optimization on your website, using paid social marketing campaigns or Google Adword campaigns, and doing cross-promotions with other brands.
2. Conversion Rate
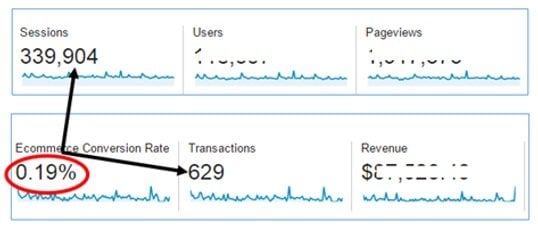
This metric is calculated by dividing the number of purchases made via your site by the number of sessions your site receives. As Nagy mentioned during his talk, it’s important to know that online retail has conversion numbers that are much lower than traditional brick and mortar operations. In his experience, 1.5 per cent is an average online conversion rate.
He went on to say that the best way to improve your conversation rate is to be clear: explain immediately and clearly what it is you’re selling on your site. Improve your photography for example, remove any clutter and make your site cleaner and utilize well-written, to-the-point product descriptions.
3. Average Order Value
The Average Order Value (AOV) metric indicates the average dollar value of each transaction on your e-commerce site and is calculated by dividing total sales by individual purchases during a specific period. For example, if you sold $100 worth of goods on a given day and there were 5 transactions, the average order value is $20.
Unlike conversion rate, it can be tricky to improve AOV but as we’ve learned from such ubiquitous marketing phrases as “Would you like fries with that?” there are effective ways to upsell customers, even at an online checkout. One possibility Nagy suggests is offering high-profit margin accessories. For example, if someone’s ordering a pair of shoes on your site, try to get them to add socks to your order. Or, as we’ve seen on many online shopping platforms, offer free shipping at a certain price point, which could convince the customer to buy something else.
Once these three e-commerce revenue indicators are being tracked, it becomes much easier to improve them using methods mentioned above such as search engine optimization, social media campaigns and free shipping breakpoints at checkout. For more about how to use analytics to improve your company’s online sales, contact David Nagy at david@ecommercecanada.com and visit his website eCommerceCanada.com.


